5.1. Engagement with Course Content#
How many of the enrolled learners are actually keeping up with the work? What are they doing? Content engagement data helps you monitor how many learners are active in your course and what they are doing.
Content engagement data is updated every week for the period Monday at 00:00 UTC through Sunday at 23:59 UTC.
5.1.1. Gaining Insight into Learner Engagement#
EdX Insights delivers data about learner engagement in a chart, a set of metrics, and a report that you can view or download. Descriptions follow; for detailed information about the computations, see Computation Reference.
5.1.1.1. Weekly Learner Engagement Chart#
The markers on this chart represent the number of unique learners who interacted with course content. The graph plots the following categories of engagement.
The count of learners who completed any type of course activity.
The count of learners who played any course video.
The count of learners who submitted an answer for a problem.
The count of learners who added a post, response, or comment to the course discussion.
Each total is for activity completed within a one week period. To see the total count for each activity type for a given week, move your cursor over the chart to display a tooltip.
Activity is included beginning with the week in which the first page visit took place. The first page visit is typically by a member of the course team shortly after course creation. This data is also available for review in tabular format and can be downloaded. See the Content Engagement Breakdown report.
Examples of the Weekly Learner Engagement chart follow. The first example shows a course a few weeks after the start date. The numbered callouts in the image provide context for the data that is shown.
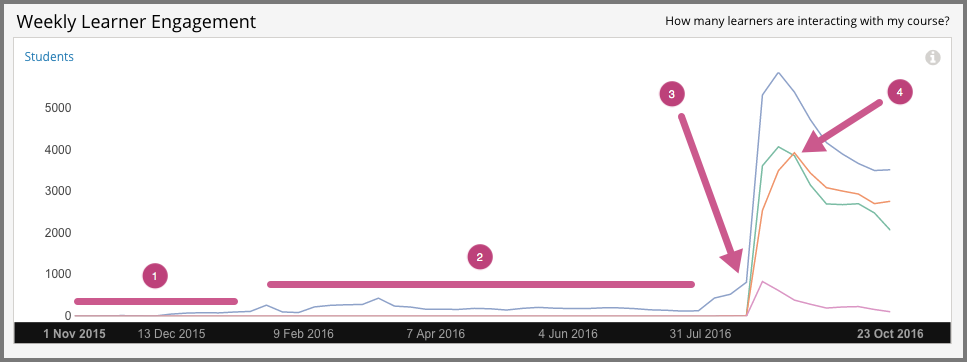
Course development on edx.org, a period when engagement levels were low in all three categories.
Beta testing, when a slight increase in all of the engagement categories can be detected, and ongoing course development.
The course start date, when the number of active learners increased significantly.
The due date of the first homework, when the number of learners who tried a problem increased.
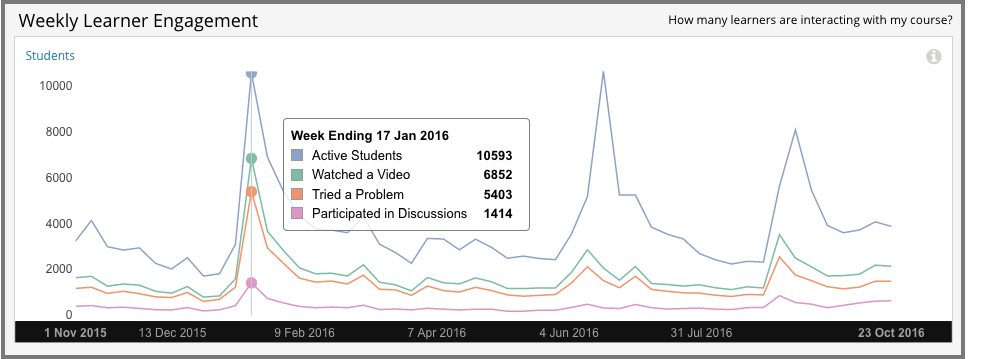
The second example is for the edX Demo course. This self-paced course runs continuously. The tooltip shows the number of learners engaging in different activities in a high volume week.
5.1.1.2. Active Learners Last Week Metric#
The number and percentage of learners who, at least once, visited a page in the course during the last complete one week period.
5.1.1.3. Watched a Video Last Week Metric#
The number and percentage of learners who played at least one of the course videos during the last complete one week period.
5.1.1.4. Tried a Problem Last Week Metric#
The number and percentage of learners who submitted an answer for at least one problem during the last complete one week period. Not all problem types are included in this count; see Engagement Computations.
5.1.1.5. Participated in Discussions Last Week#
The number and percentage of learners who added a post, response, or comment to the course discussion during the last complete one week period.
5.1.1.6. Content Engagement Breakdown Report#
The weekly breakdown of learner engagement with course content is available for review or download. Columns show each Week Ending date and the count and percentage of active learners, learners who watched a video, and learners who tried a problem.
You can download the Content Engagement Breakdown report in comma-separated value format: select Download CSV. The CSV file contains the following columns.
any (active learners)
attempted_problem
course_id
created (shows the date and time of the computation)
interval_end (shows the ending date of the one-week period)
interval_start (shows the beginning date of the one-week period)
played_video
posted_forum
See the Computation Reference chapter for a detailed description of each value.
5.1.2. Analytics in Action: Interpreting Data About Learner Engagement#
Many online courses experience periodic drops in learner activity that can be closely correlated to specific events: problem due dates. Teams can forecast these changes in engagement, implement strategies to mitigate them, and use weekly activity counts to monitor their reach.
5.1.2.1. An Immediate Appeal, then Ongoing Encouragement#
To set expectations and encourage a minimum time commitment, one professor included a one-minute video message as the very first course component. Speaking directly to the camera, the professor acknowledged that the material could be daunting. He then made a very specific request: that learners complete not only the first homework assignment, but the entire first month of the course, before they made a decision to stop. The professor followed this initial video with a weekly message to the learners.
The completion and certification rates for the course were higher than average for the subject. In the course exit survey, learners indicated that the video messages had a significant motivating effect.
5.1.2.2. Motivation through Public Recognition#
Some professors encourage learners to stay involved by publicly recognizing the contributions that they make to the learning environment.
In one course, the professor wrote weekly updates. Each week she recognized learners, by username, for their insightful comments in the course discussions.
Another professor gave special attention to learner questions. He updated the course Home page regularly with questions taken from the discussions. He followed each question by thanking the learner and giving a direct and in-depth answer.
If you post ongoing, regular updates to spotlight learner work, you might consider adding another element to stimulate involvement. You can include the count for who tried problems last week, and challenge your learners to increase participation in the coming week.
5.1.2.3. Gauging the Effectiveness of an Investment#
Some teams develop a learner engagement strategy for their courses that is similar to a marketing campaign. They plan the timing and content of messages to learners and use a variety of delivery channels. If social media channels are used, messaging typically is delivered daily or even more frequently. Bulk email messages are usually sent less frequently, and may have longer content. By comparing the levels of learner engagement week over week, or from run to run, you can make comparisons to evaluate your strategy.